

Geophysics has shown that precise measurements and a little modeling can perform wonders, like showing us the detailed structure of the Earths interior despite the fact that it is inaccessibly buried beneath hundreds of kilometers of rock. This is possible because seismic waves produced by earthquakes subtly change velocity or direction as they pass through different materials. A new paper shows that something similar can actually measure small temperature changes in the deep ocean.
An idea to use acoustic waves from man-made sources was actually floated several decades ago but died out after some trials. A team led by Wenbo Wu at the University of Toronto realized that earthquakes could be taken advantage of in the same way, removing the expensive logistics of constantly setting off booms to get measurements, as well as concerns about the effects on marine life.
There are actually several types of seismic waves released by earthquakes, and each behaves a bit differently. The P-wave (P for “primary” because its the first to arrive) is analogous to a sound wave, as it compresses the rock in the same direction its traveling. So where this wave reaches the seafloor or the ground surface, the rock can behave like a massive speaker, producing a very low-frequency sound wave in the air or water.
That same process can work in reverse, too. Say theres an earthquake below the seafloor just off a coastline. The seafloor motion can create a sound wave that travels across an ocean basin and re-enters the seafloor rock of an opposing coast. This is actually detectable by seismometers as vibration that arrives extremely late—because the wave travels much slower through water than through rock. As it shows up after the primary and secondary seismic waves, this weird acoustic straggler is called a tertiary or T-wave.
T-wave travel speed is sensitive to water temperature, with warmer water slowing it down. (Complicating things slightly is that its also slightly sensitive to changes in salt concentration or current movement, but the researchers say the temperature effect dominates.) Seismometers are sensitive enough to detect very small differences in timing, so this is capable of measuring changes of much less than 1 °C.
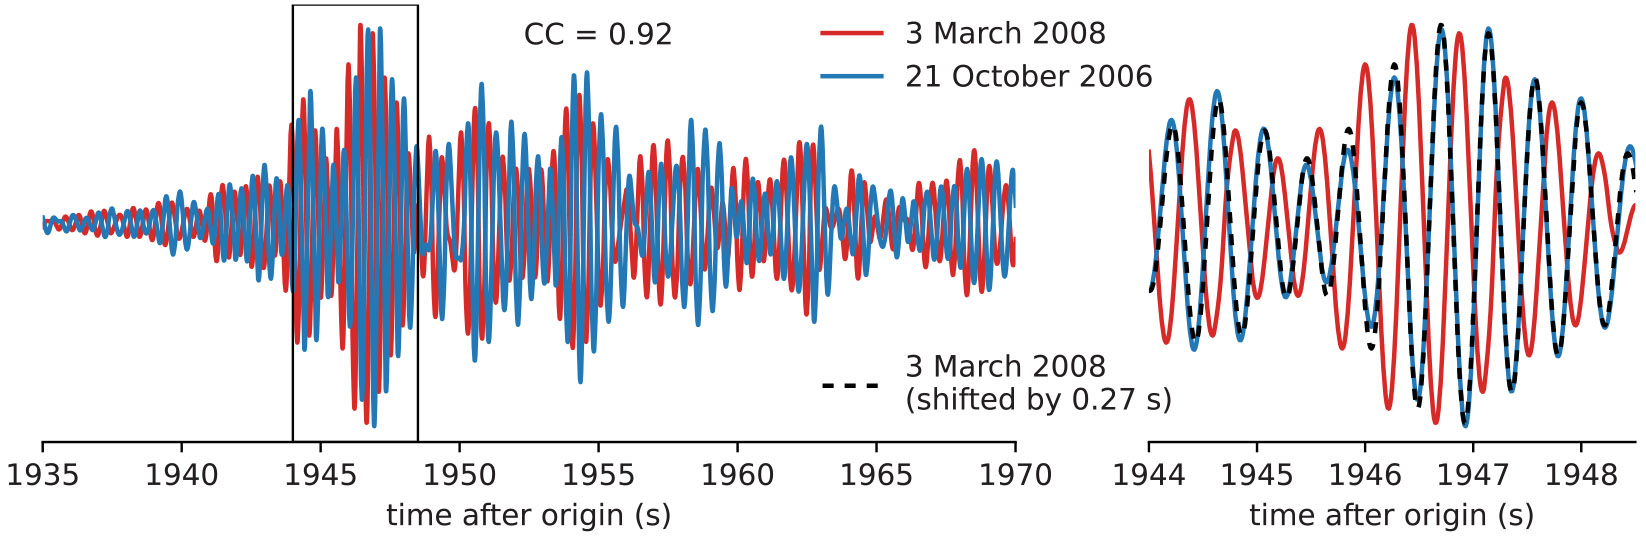
But to calculate a change, you obviously need at least two measurements. That means you need an earthquake that is nearly identical to a previous one—what the researchers call a “repeater." Its not necessary for these earthquakes to be huge, however, so this isnt as difficult as you might think.
It's no problem atoll
To show that this works, the researchers used a seismometer station on Diego Garcia, a small atoll in the Indian Ocean about 3,000 kilometers from Sumatra. The tectonic plate boundary there is incredibly active, so theres no shortage of earthquakes to work with. Between 2004 and 2016, there were over 4,000 earthquakes of magnitude 3.0 or higher that occurred near the Nias Island area of Sumatra. The researchers carefully processed all of these events to find repeaters similar enough to do the temperature calculation. They found over 2,000 such pairs based on 900 earthquakes.
If this portion of the Indian Ocean were to warm 1 °C, T-waves from those earthquakes would take 5.4 seconds longer to reach this seismometer. The observed changes are smaller than that but they are coherent—theres both an annual cycle and a gradual warming trend that look similar to other, more traditional, datasets.
The trend calculated by this “seismic ocean thermometry” is slightly larger, though. The researchers compare to estimates from the automated Argo array of floats and to NASAs ECCO dataset, which combines data from different sources. Over the same time period, Argo shows a warming trend of 0.026 °C per decade in this area, while ECCO shows 0.039 °C per decade. The seismic estimate comes in at 0.044 °C per decade.

arstechnica
[contfnewc] [contfnewc]


