The Greenland Ice Sheets unhealthy and rapid weight loss—and contribution to sea level rise—occurs by a handful of mechanisms. In short, ice at the edge of the glacier can melt or break off into icebergs, and surface snow farther inland can melt. That snow melt is a bit like rainfall, in that it can either soak into the snow or runoff in streams.
Where it trickles down into the denser snow beneath, it refreezes and forms a stubborn layer that will continue to be visible when that snow is compressed into glacial ice. That means that drilling an ice core can give you a record of past surface melting events.
Greenland has experienced a remarkable amount of surface melting over the past couple decades, including the record-setting summer of 2012 that saw virtually the entire ice sheet melting at the surface. Because surface melting had historically been an unusual event akin to newsworthy heat wave, glaciologists wanted to put this into context. How much of Greenlands recently accelerating ice loss was due to natural variability, and how much was due to human-caused trends?
We have excellent records of surface melt over the satellite era, but a team led by Rowan Universitys Luke Trusel turned to ice cores from western Greenland to build a much longer record. From three new cores and one existing one, they were able to compile a detailed history of surface melt events going back over 350 years.
After analyzing the cores and identifying the timing and thickness of all the melt refreeze layers, they started by comparing those results to the available observations for recent years. That confirmed that their method was accurately tracking surface melt events.
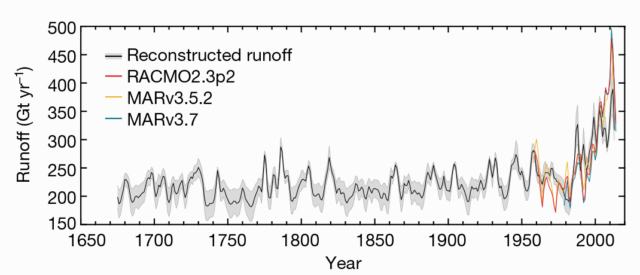
Their record shows that the melting over the last two decades are well outside the range of natural variability. In fact, it produces yet another hockey-stick shaped graph.

The researchers write that “relatively stable and low runoff occurred before the 1990s.” Since then, the amount of melting has increased to about 33 percent above the 20th century average, and 50 percent above pre-Industrial-Revolution behavior. The ice-sheet-wide melting in 2012 stands out as the biggest event in the entire record.
The relationship between temperature and surface runoff is, in fact, non-linear. That makes sense, because as you build layers of ice in the snow, the next melt event is more likely to be stuck flowing along the surface rather than soaking in.
If you assume the relationship between temperature and surface melt held constant in the past, you can infer something going even further back than the 350 years represented in these ice cores. It would mean that the last decade is unprecedented in at least 7,000 years.
As for the specific reason behind Greenlands sudden turn for the worse (beyond the obvious connection to global warming), the researchers list a few possibilities. This includes some slow-changing natural temperature oscillations in the Atlantic and Pacific Oceans, but also the fact that Arctic sea ice loss became large around the same time. Sea ice keeps a lid on the warmer (relatively speaking) seas. With less sea ice coverage, the oceans have more and more influence on atmospheric temperatures around Greenland. Whether that can help explain this ice core record is a question other studies will have to try to answer.
What we do know is that the ice cores tell us to expect even more melting snow flowing off Greenland in the coming years as temperatures continue to climb.
Nature, 2018. DOI: 10.1038/s41586-018-0752-4 (About DOIs).
[contf] [contfnew] 
Ars Technica
[contfnewc] [contfnewc]


