Sea level rise is an unambiguous consequence of climate change. Warmer water expands, while melted land ice flows into the sea. But what fun would it be if the natural world didnt make things a little more complicated? A number of processes can cause the trends experienced on different coasts to vary, from ocean circulation to rising or falling land elevation. Although we've wanted to quantify each contributor to sea level rise, it should be no surprise that the numbers dont always add up perfectly.
So researchers have turned to a process called “closing the budget”—working on adding estimates of ice mass loss, thermal expansion of seawater, and change of water storage on land, and then comparing that to estimated sea level trends from tide gauges and satellites. Research has closed the budget for recent decades, including the era of good satellite data starting around 1990, and extending that back to about 1960. But in the first half of the 20th century, tide gauges are sparser, as are observations of glaciers and ocean temperatures. As a result, a mismatch has remained between what we'd expect based on estimated sea level rise causes and what we think we saw, based on estimated sea level rise. There was apparently more sea level rise than we could explain in that time period.
Try, try again
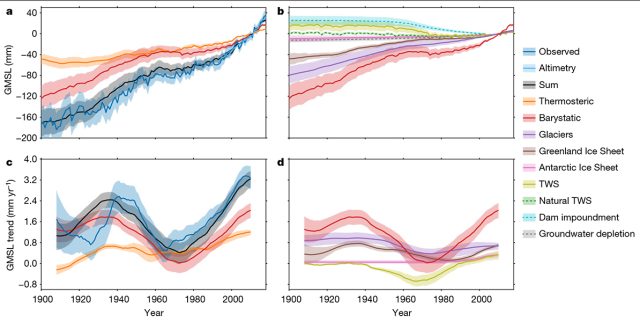
Researchers have been working on these problems from every angle, cleaning up dataset problems and tackling complications like land-elevation changes. So a team led by Thomas Frederikse at Caltechs Jet Propulsion Laboratory decided it was time to try again. Frederikse and his colleagues find that estimates are now consistent all the way back to 1900. And that includes a couple of time periods of higher or lower rates of sea level rise along the way.
Combining every dataset they could get their hands on, these researchers calculated global and regional estimates from 1900 to 2018. They preserve all the error bars by generating 5,000 realizations with randomly selected possible values (known as a Monte Carlo analysis).
They separate the effect of temperature on expanding ocean water volume (“thermosteric” sea level rise) from the factors that add water to the oceans (“barystatic” sea level rise). Those include the melting of mountain glaciers and the sheets of Greenland and Antarctica, as well as the depletion of groundwater resources. Offsetting those is the construction of dams, which create surface-water storage on land that didnt exist before.
Their estimated average rate of sea level rise for 1900-2018 is 1.56±0.33 millimeters per year. The sum of all the sea level change factors is 1.52±0.33 millimeters per year—a comfortable match.

Estimates also match within error bars for 1957-2018 and 1993-2018, but these periods see accelerating sea level rise, with rates increasing to about 1.78 millimeters per year and then 3.35 millimeters per year.
What came from where
For the first half of the 20th century, water added to the oceans accounts for over 80 percent of total sea level rise, although dam-building eats into that number in the second half of the century. Heres a simpler comparison: since 1900, melting glacial ice has caused twice as much sea level rise as expansion due to warming.
The two biggest deviations in the 20th century center on the 1940s, when sea level rose a little faster, and the 1970s, when sea level rose a little slower. Its interesting that the global temperature trend varied somewhat similarly, but thermal expansion is not what caused these sea level variations.
In the 1940s, the uptick looks to be due to greater losses of ice from mountain glaciers and Greenland. The slowdown in the 1970s, on the other hand, corresponds to a peak in dam construction on land that “stole” water from the oceans by filling new reservoirs.
Zooming in to individual ocean basins, even more factors have to be considered. While tRead More – Source
[contf] [contfnew] 
arstechnica
[contfnewc] [contfnewc]


