

One of the more obvious risks of climate change is an increased frequency of extreme heatwaves. Particularly in cities, heatwaves can be more than sticky and unpleasant—they can be deadly.
The emissions cuts pledged so far in the international Paris Agreement in 2015—if followed through—would limit global warming to the neighborhood of 3°C. That won't prevent an increase in deaths due to heatwaves, but just how much worse is 3°C than the international goals of stopping warming at 2°C or event 1.5°C?
To find out, a team led by Eunice Lo at the University of Bristol analyzed the relationship between extreme summer temperatures and deaths for 15 US cities with data: Atlanta, Boston, Chicago, Dallas, Detroit, Houston, Los Angeles, Miami, New York City, Philadelphia, Phoenix, San Francisco, Seattle, St. Louis, and Washington DC.
Turning up the (simulated) heat
Using climate model simulations, Lo and her team estimated the changes in summer temperatures for these cities at 1.5°C, 2°C, and 3°C of global warming. (The first two scenarios had already been done, but they added a 3°C scenario run by the volunteer weather@home computing network.) The warmest days on land (as opposed to over the ocean) generally increase faster than the global average, so the difference between these scenarios is more than you might think. The half-degree difference between 1.5°C and 2°C, for example, translates to a 0.6°C to 1°C (about 1 to 2°F) increase in summer extremes for these cities.
Using the simplifying assumptions that population doesn't change, vulnerability to heatwaves does not increase, and adaptations aren't undertaken (more on these later), the researchers were able to apply the past heatwave-death relationships to these higher temperatures. Because there is a threshold where temperature and humidity crosses into the danger zone, the differences in these scenarios can be stark. For example, San Francisco would see a month of additional days with an elevated risk of deaths in the 3°C scenario than it would in the 2°C scenario.
By counting up the days above the threshold, you can compare the change in estimated heat-related deaths to the average number of deaths from all causes. The difference between a 1.5°C world and a 3 °C world is an increase in the fraction of heat-related deaths of 1 percent in Chicago or 3 percent in Philadelphia. That is, an additional 1 or 3 percent of all deaths would be heat-related.
Extreme events
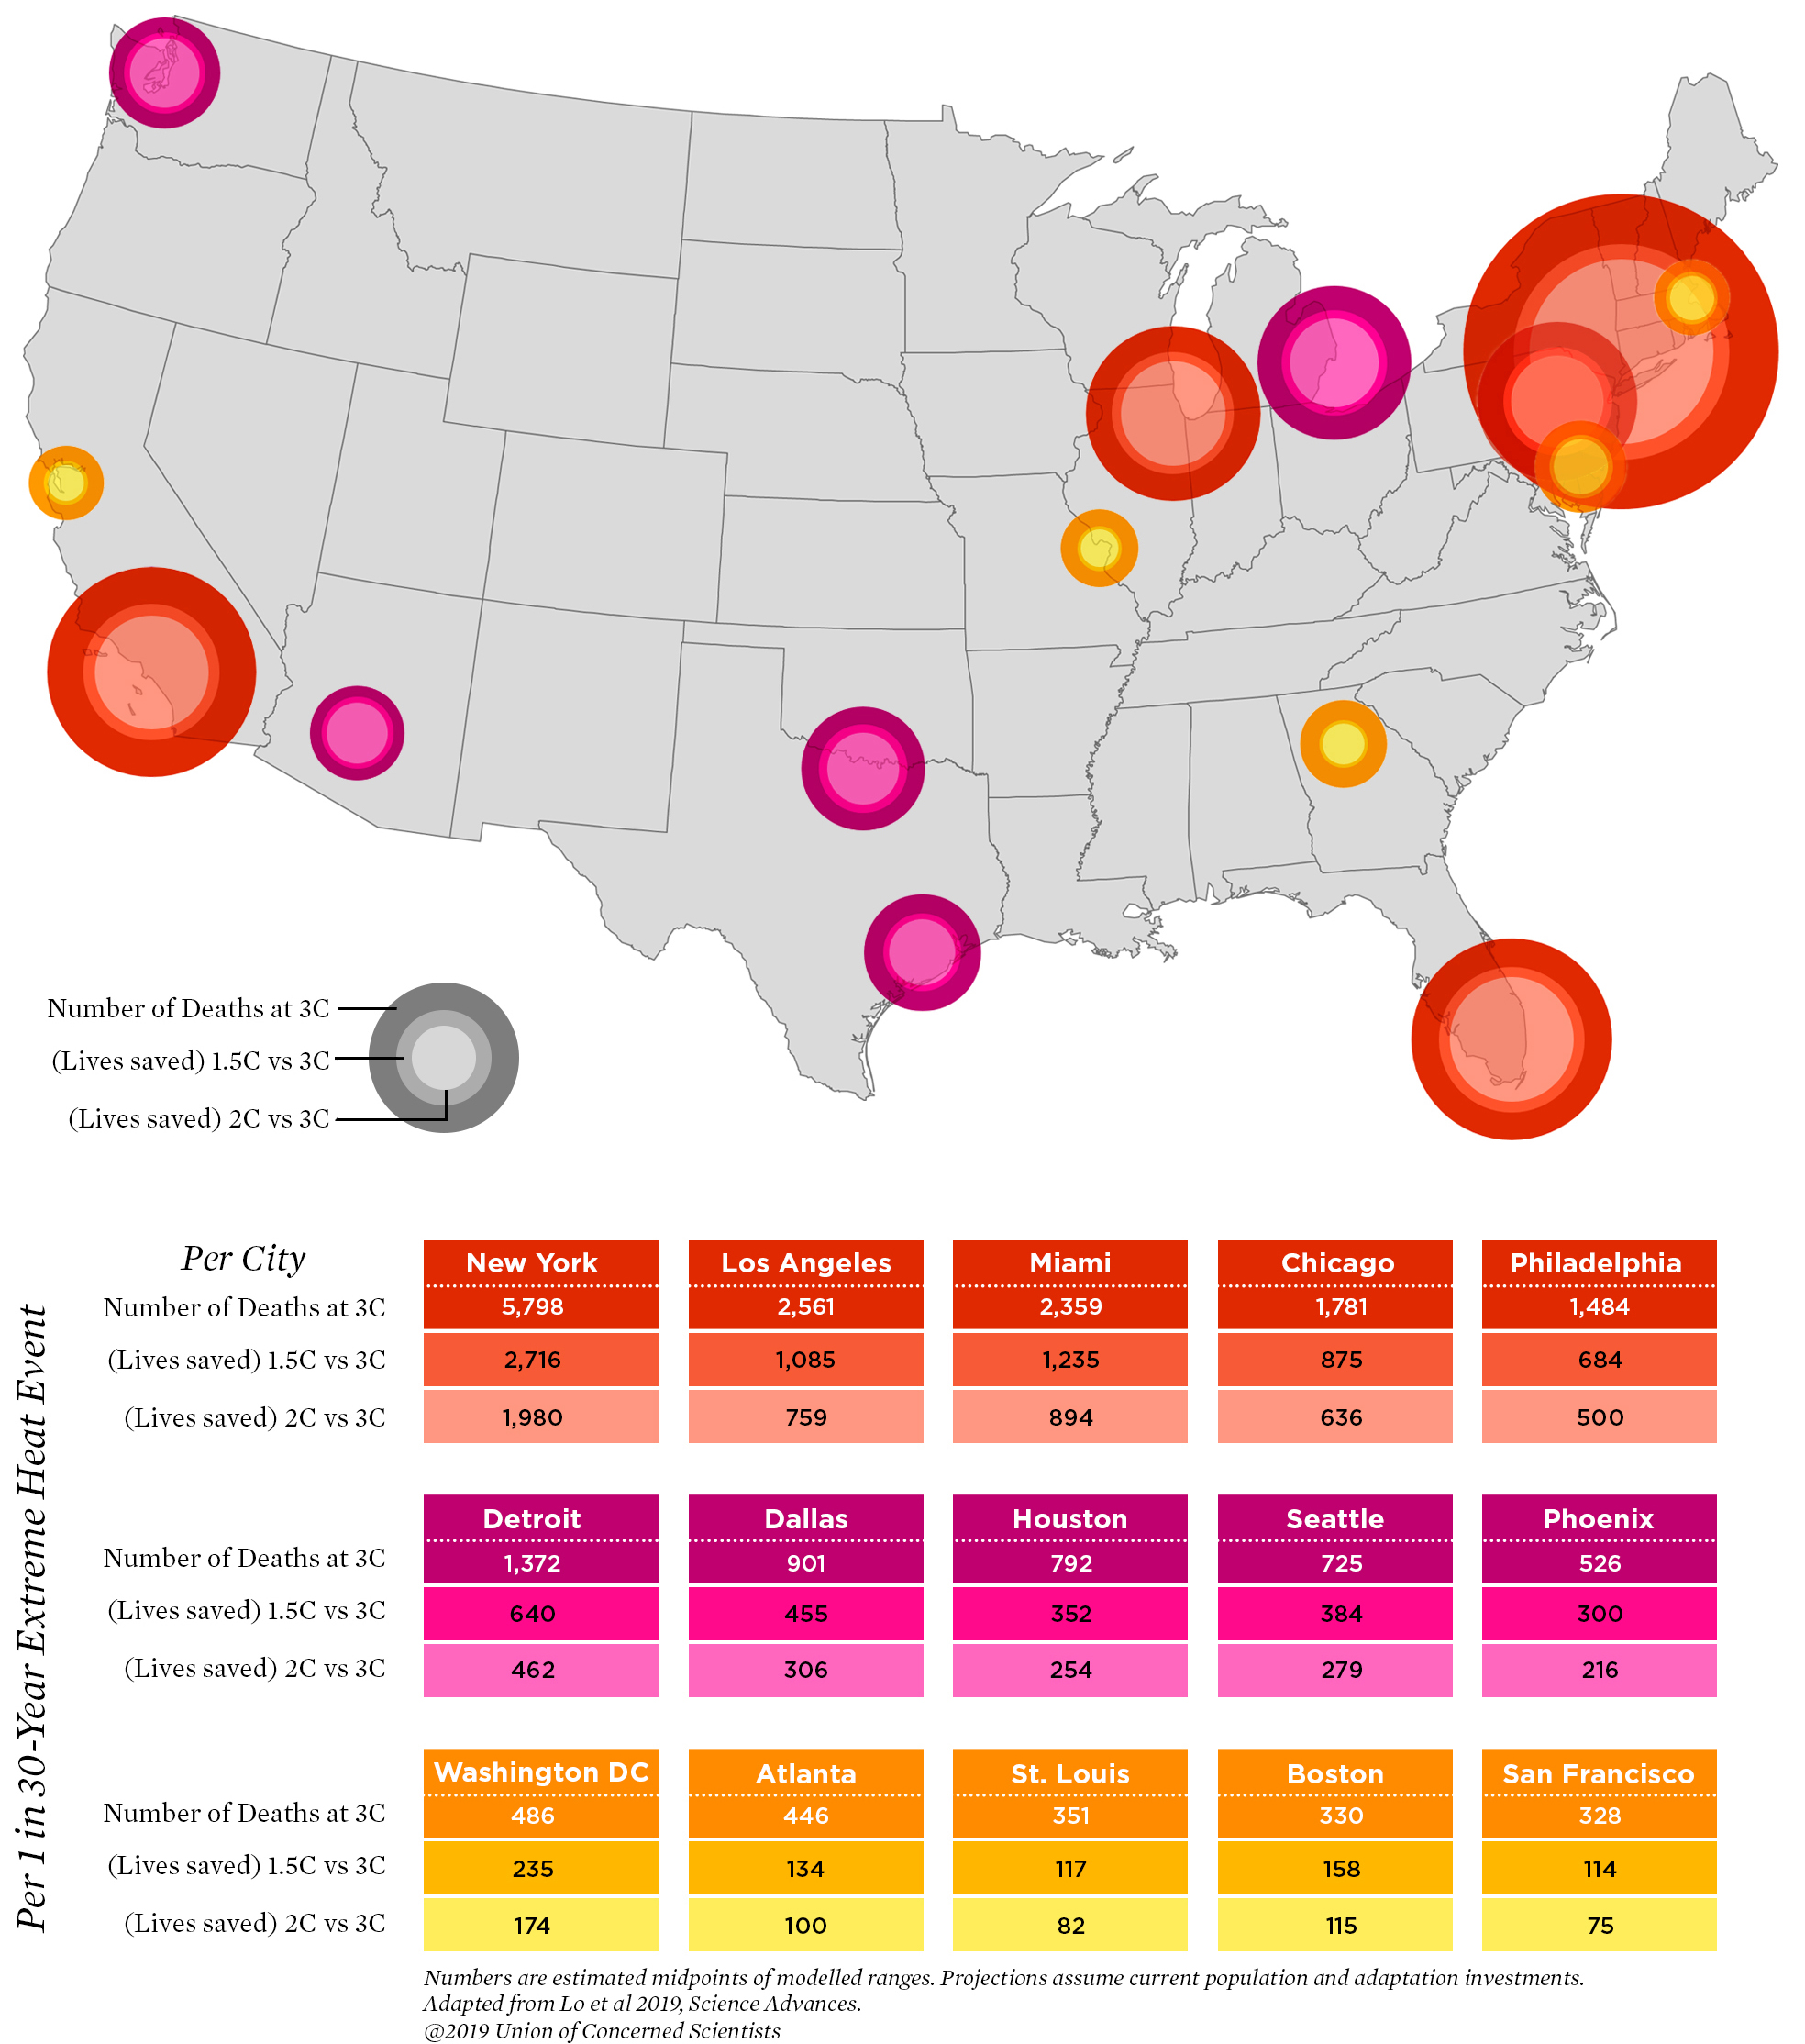
For what is perhaps a more concrete comparison, the researchers also zeroed in on especially extreme heatwave events. From their model simulations (which generated 900 years of weather), they identified the magnitude of the once-in-30-years heatwave—the kind of weather event that makes news. Then they calculated the estimated number of deaths that would result from such a heatwave in each scenario.
The biggest effects are found in the biggest cities. Take New York: going from a 1.5°C to 3°C global warming means an additional 2,700 deaths in a heatwave like that. The difference between 2°C to 3°C is 2,000 deaths. In LA, the lives saved in those scenarios are about 1,100 and 750, respectively.

Ars Technica
[contfnewc] [contfnewc]


