

For a young student, report-card season can be an exciting, stressful, or even depressing time of year. The annual tally of the worlds climate-changing greenhouse gas emissions is a little like that—but with a lot more on the line than a B in language arts. And unfortunately, 2018s tally once again brings us short of a passing mark.
This annual project is the work of a large group of carbon-cycle scientists that updates the books to be as accurate a record as possible. The scientists also project the final tally for the current year based on all the available data at the time of publication.
Last year, for example, the projection for 2017 was a global CO2-emissions increase of 2 percent, with error bars spanning 0.8–3.0 percent. This years update to the dataset puts the actual number at 1.6 percent. Interestingly, Chinas emissions were projected to grow 3.5 percent (range 0.7–5.4 percent), but they appear to have ended up just 1.5 percent higher. Still, that brought an end to a brief stretch when Chinas emissions had actually declined from a 2013 peak.
Projections for 2018 signal that a renewed growth of global greenhouse gas emissions is underway. The global total is projected to increase by around 2.7 percent over last year. Even US emissions, which have been slowly declining for about a decade, look to bounce up about 2.5 percent in 2018. However, that seems to be primarily because of the weather—higher-than-normal heating demand in the winter and cooling demand in the summer. Dont expect that bounce to continue next year.
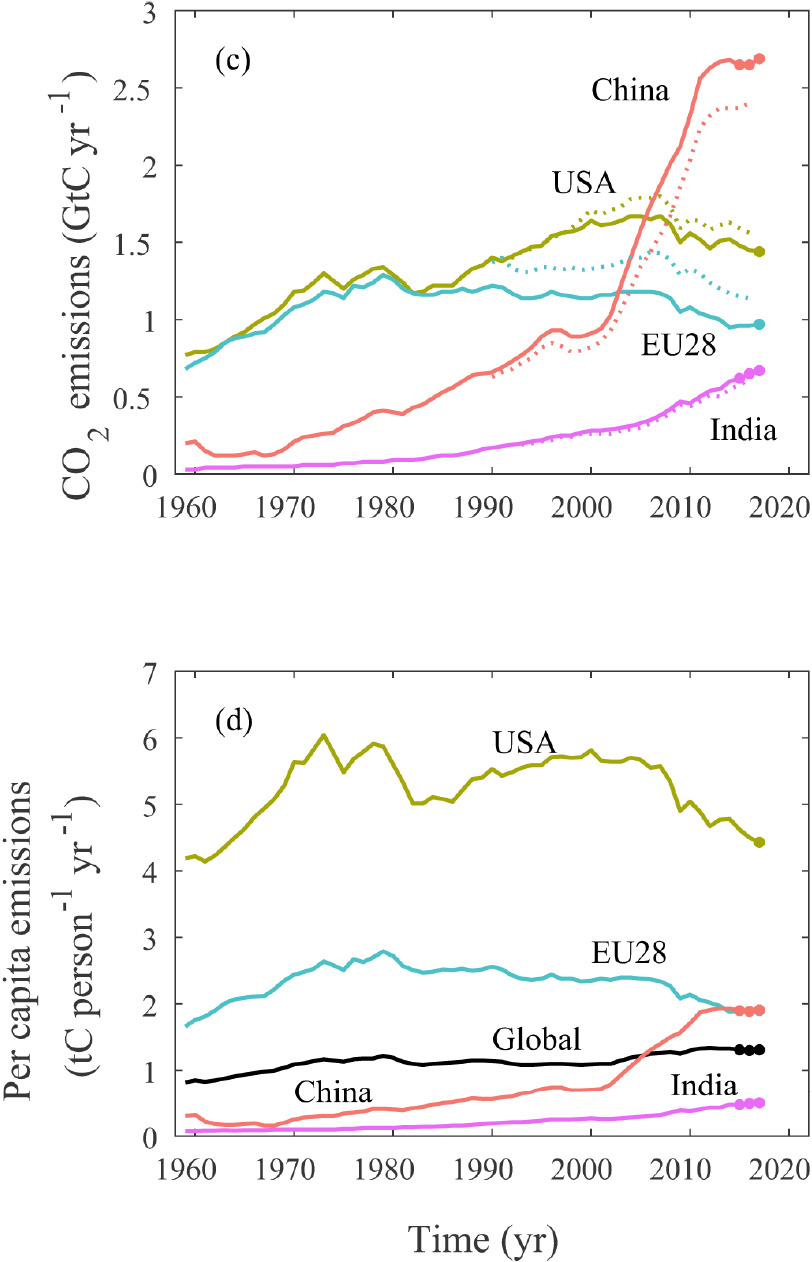
Emissions from the 28 European Union nations (which still includes the UK) are projected to decline 0.7 percent, roughly maintaining a long-term trend. Emissions in rapidly developing India, on the other hand, are projected to rise 6.3 percent (range 4.3–8.3 percent) thanks to strong growth in coal and oil use.
China, too, is seeing a significant uptick and is projected to grow by 4.7 percent (range 2–7.4 percent) this year. While the strongest growth there is in natural gas use (up almost 18 percent), coal use also went up 4.5 percent despite a trend away from that fuel.
Per capita emissions provide important context to these numbers, which relate to nations or groups of nations with vastly different populations. The average person in the United States is still responsible for far more emissions than anyone in these other groups. Indias per capita emissions are slowly growing from an extremely low value, reflecting the fact that many people dont even have electricity yet. And following Chinas incredible economic growth, its per capita emissions are now equivalent to Europes.
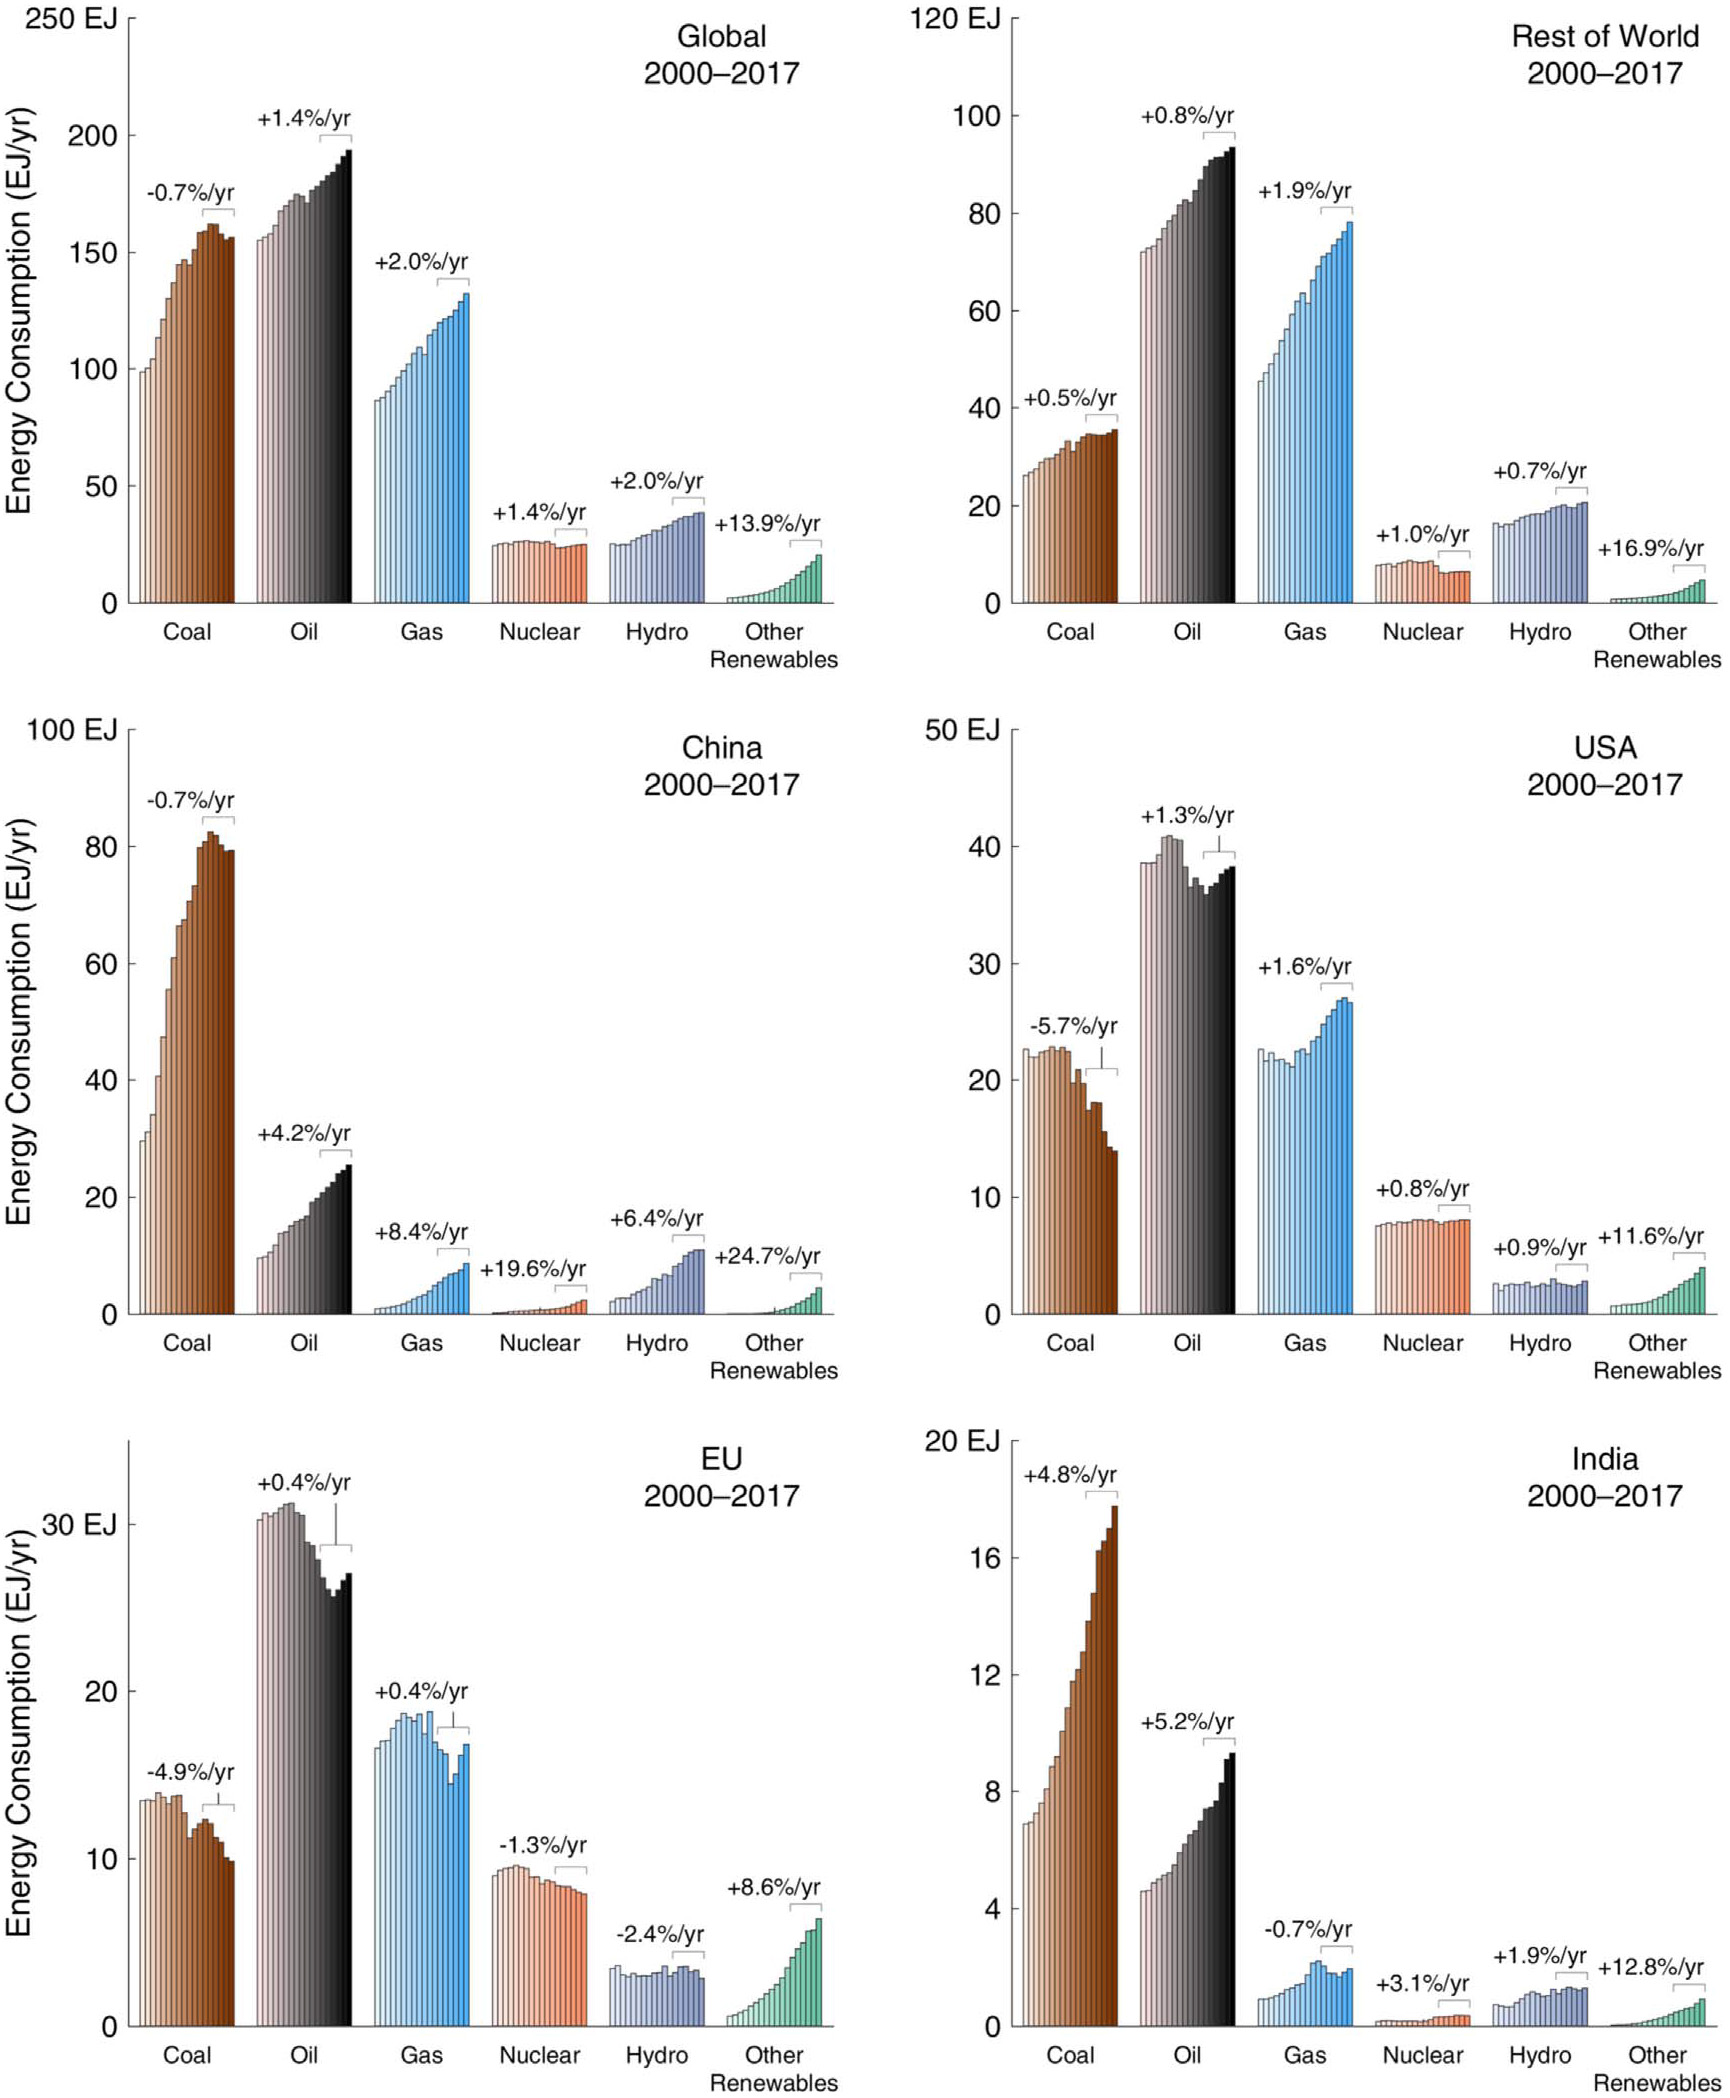
In the absence of a crystal ball, its tempting to over-interpret the numbers from any individual year and extrapolate into the future. But as the US emissions show, there is some variability to keep in mind. As for the immediate future, the researchers note that economic growth is still being fueled more by coal, oil, and gas than renewables. As a result, the best bet is that emissions will increase again in 2019. This doesnt mean the worlds nations wont hit their pledged emissions cuts by 2030, but it does mean were still going in the wrong direction.
As the researchers put it, “A quarter century after the United Nations Framework Convention on Climate Change, we remain far from its signature goal to stabilize greenhouse gas concentrations in the atmosphere at a level that would prevent dangerous anthropogenic interference with the climate system.”
[contf] [contfnew] 
Ars Technica
[contfnewc] [contfnewc]


